helping <- read_csv("data/altruism_full.csv")Analysis I
Applied Multiple Regression/Correlation Analysis for the Behavioral by Jacob Cohen, Patricia Cohen, Stephen G. West, Leona S. AikenSciences
helping <- helping |>
    mutate(
        status = factor(status, levels = c("low", "high")),
        sex = factor(sex)
    )

helping |> print()
# A tibble: 168 × 6
id status sex empathy public_sc helping
<dbl> <fct> <fct> <dbl> <dbl> <dbl>
1 1 high female 58.1 88.3 33.8
2 2 low female 43.9 29.8 63.8
3 3 low female 76.8 80 61.0
4 6 high male 42.6 45.2 1.23
5 8 low male 80.6 52 20.8
6 9 high male 44.2 69.2 7.61
# … with 162 more rowssummary(mod <- lm(helping ~ public_sc * status + empathy, data = helping))
Call:
lm(formula = helping ~ public_sc * status + empathy, data = helping)

Residuals:
    Min      1Q  Median      3Q     Max
-65.117 -14.950  -1.137  15.982  48.022

Coefficients:
                     Estimate Std. Error t value Pr(>|t|)
(Intercept)           -0.3143    11.9954  -0.026  0.97913
public_sc             -0.2133     0.1689  -1.263  0.20849
statushigh           -40.9460    17.0374  -2.403  0.01737 *
empathy                0.7392     0.1510   4.895 2.35e-06 ***
public_sc:statushigh   0.6423     0.2203   2.916  0.00405 **
---
Signif. codes:  0 ‘***’ 0.001 ‘**’ 0.01 ‘*’ 0.05 ‘.’ 0.1 ‘ ’ 1

Residual standard error: 22.68 on 163 degrees of freedom
Multiple R-squared:  0.293, Adjusted R-squared:  0.2756
F-statistic: 16.88 on 4 and 163 DF, p-value: 1.335e-11summary(mod <- lm(helping ~ scale(public_sc) * status + empathy, data = helping))
Call:
lm(formula = helping ~ scale(public_sc) * status + empathy, data = helping)

Residuals:
    Min      1Q  Median      3Q     Max
-65.117 -14.950  -1.137  15.982  48.022

Coefficients:
                            Estimate Std. Error t value Pr(>|t|)
(Intercept)                 -16.3357    11.1328  -1.467  0.14421
scale(public_sc)             -3.4988     2.7708  -1.263  0.20849
statushigh                    7.3082     3.5847   2.039  0.04310 *
empathy                       0.7392     0.1510   4.895 2.35e-06 ***
scale(public_sc):statushigh  10.5379     3.6139   2.916  0.00405 **
---
Signif. codes:  0 ‘***’ 0.001 ‘**’ 0.01 ‘*’ 0.05 ‘.’ 0.1 ‘ ’ 1

Residual standard error: 22.68 on 163 degrees of freedom
Multiple R-squared:  0.293, Adjusted R-squared:  0.2756
F-statistic: 16.88 on 4 and 163 DF, p-value: 1.335e-11library(car)
avPlots(mod)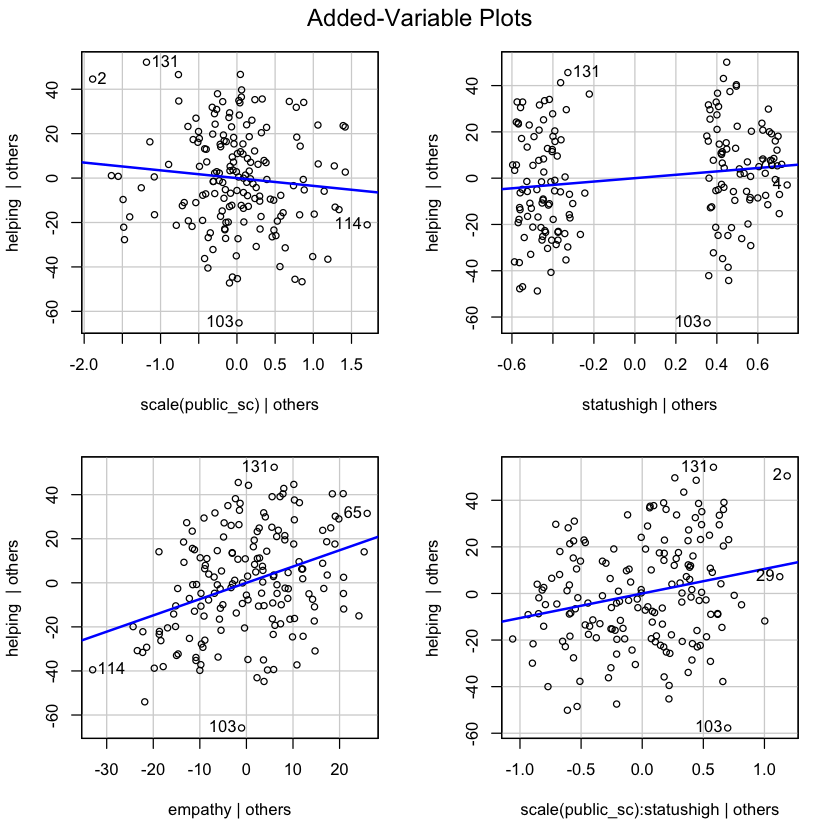
summary(lm(scale(helping) ~ status, data = helping))
Call:
lm(formula = scale(helping) ~ status, data = helping)

Residuals:
     Min       1Q   Median       3Q      Max
-1.73766 -0.70655 -0.09683  0.73752  1.98321

Coefficients:
            Estimate Std. Error t value Pr(>|t|)
(Intercept)  -0.1922     0.1041  -1.846  0.06662 .
statushigh    0.4086     0.1518   2.692  0.00782 **
---
Signif. codes:  0 ‘***’ 0.001 ‘**’ 0.01 ‘*’ 0.05 ‘.’ 0.1 ‘ ’ 1

Residual standard error: 0.9818 on 166 degrees of freedom
Multiple R-squared:  0.04184,   Adjusted R-squared:  0.03607
F-statistic: 7.25 on 1 and 166 DF, p-value: 0.007819summary(lm(scale(helping) ~ empathy, data = helping))
Call:
lm(formula = scale(helping) ~ empathy, data = helping)

Residuals:
     Min       1Q   Median       3Q      Max
-2.01691 -0.65267 -0.03413  0.62921  2.02464

Coefficients:
             Estimate Std. Error t value Pr(>|t|)
(Intercept) -2.296418   0.329699  -6.965 7.31e-11 ***
empathy      0.031909   0.004484   7.117 3.16e-11 ***
---
Signif. codes:  0 ‘***’ 0.001 ‘**’ 0.01 ‘*’ 0.05 ‘.’ 0.1 ‘ ’ 1

Residual standard error: 0.878 on 166 degrees of freedom
Multiple R-squared:  0.2338,    Adjusted R-squared:  0.2292
F-statistic: 50.65 on 1 and 166 DF, p-value: 3.158e-11summary(lm(scale(helping) ~ empathy + status, data = helping))
Call:
lm(formula = scale(helping) ~ empathy + status, data = helping)

Residuals:
     Min       1Q   Median       3Q      Max
-2.13949 -0.61254 -0.07061  0.60338  1.99294

Coefficients:
             Estimate Std. Error t value Pr(>|t|)
(Intercept) -2.349779   0.326929  -7.187 2.17e-11 ***
empathy      0.030721   0.004467   6.878 1.20e-10 ***
statushigh   0.295364   0.135204   2.185   0.0303 *
---
Signif. codes:  0 ‘***’ 0.001 ‘**’ 0.01 ‘*’ 0.05 ‘.’ 0.1 ‘ ’ 1

Residual standard error: 0.8682 on 165 degrees of freedom
Multiple R-squared:  0.2553,    Adjusted R-squared:  0.2463
F-statistic: 28.29 on 2 and 165 DF, p-value: 2.735e-11summary(mod2 <- lm(helping ~ scale(public_sc) * status, data = helping))
Call:
lm(formula = helping ~ scale(public_sc) * status, data = helping)

Residuals:
    Min      1Q  Median      3Q     Max
-65.885 -16.726  -0.607  17.828  52.431

Coefficients:
                           Estimate Std. Error t value Pr(>|t|)
(Intercept)                  43.864      2.793  15.703  < 2e-16 ***
scale(public_sc)             15.077      2.824   5.339 3.07e-07 ***
statuslow                    -7.042      3.827  -1.840  0.06757 .
scale(public_sc):statuslow  -12.154      3.842  -3.163  0.00186 **
---
Signif. codes:  0 ‘***’ 0.001 ‘**’ 0.01 ‘*’ 0.05 ‘.’ 0.1 ‘ ’ 1

Residual standard error: 24.22 on 164 degrees of freedom
Multiple R-squared:  0.189, Adjusted R-squared:  0.1742
F-statistic: 12.74 on 3 and 164 DF, p-value: 1.581e-07anova(mod2, mod) |> print()Analysis of Variance Table
Model 1: helping ~ scale(public_sc) * status
Model 2: helping ~ scale(public_sc) * status + empathy
Res.Df RSS Df Sum of Sq F Pr(>F)
1 164 96189
2 163 83862 1 12327 23.96 2.348e-06 ***
---
Signif. codes: 0 ‘***’ 0.001 ‘**’ 0.01 ‘*’ 0.05 ‘.’ 0.1 ‘ ’ 1helping |>
ggplot(aes(x = public_sc, y = helping, color = status)) +
geom_point() +
geom_smooth(method = lm) +
geom_smooth(se = FALSE)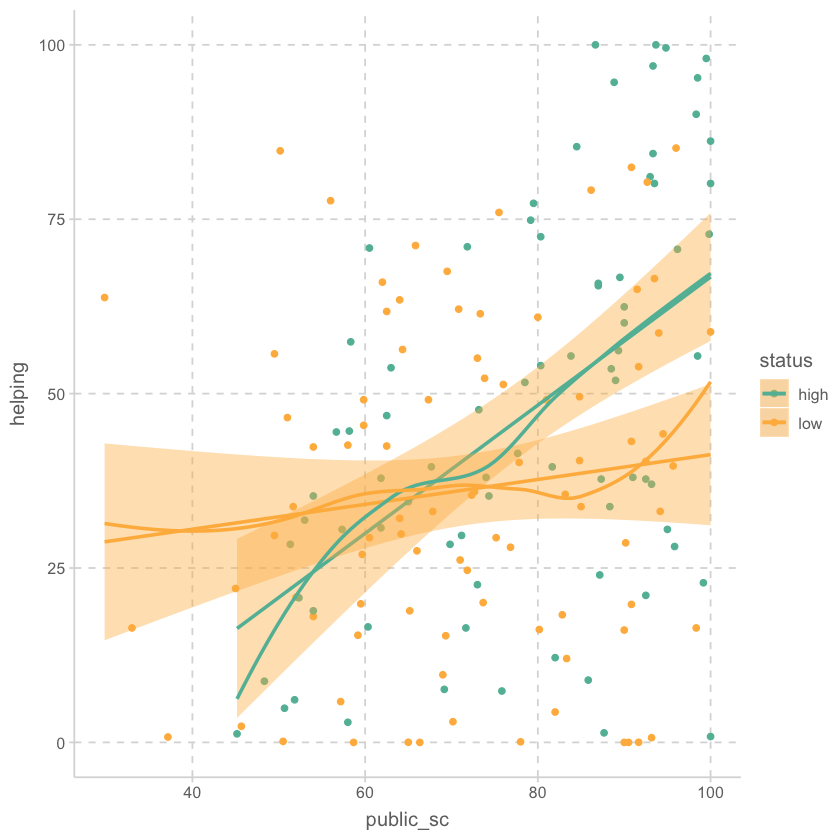
library(psych)
# R squared
corr.test(helping |> select(empathy:helping))$r^2 |>
    round(2) |>
    print()
empathy public_sc helping
empathy 1.00 0.41 0.23
public_sc 0.41 1.00 0.12
helping 0.23 0.12 1.00summary(lm(helping ~ scale(empathy) * scale(public_sc), data = helping))
Call:
lm(formula = helping ~ scale(empathy) * scale(public_sc), data = helping)

Residuals:
    Min      1Q  Median      3Q     Max
-58.326 -16.613  -0.074  16.524  53.692

Coefficients:
                                Estimate Std. Error t value Pr(>|t|)
(Intercept)                       39.644      2.070  19.151  < 2e-16 ***
scale(empathy)                    12.013      2.346   5.121 8.42e-07 ***
scale(public_sc)                   2.301      2.361   0.975   0.3312
scale(empathy):scale(public_sc)    2.735      1.620   1.688   0.0932 .
---
Signif. codes:  0 ‘***’ 0.001 ‘**’ 0.01 ‘*’ 0.05 ‘.’ 0.1 ‘ ’ 1

Residual standard error: 23.3 on 164 degrees of freedom
Multiple R-squared:  0.2495,    Adjusted R-squared:  0.2358
F-statistic: 18.17 on 3 and 164 DF, p-value: 3.138e-10summary(lm(helping ~ scale(empathy) * scale(public_sc) + scale(public_sc) * status, data = helping))
Call:
lm(formula = helping ~ scale(empathy) * scale(public_sc) + scale(public_sc) *
    status, data = helping)

Residuals:
   Min     1Q Median     3Q    Max
-66.40 -14.81  -1.10  16.81  48.70

Coefficients:
                                Estimate Std. Error t value Pr(>|t|)
(Intercept)                       43.100      2.853  15.109  < 2e-16 ***
scale(empathy)                    11.387      2.298   4.956  1.8e-06 ***
scale(public_sc)                   6.951      3.116   2.231  0.02706 *
statuslow                         -6.980      3.603  -1.937  0.05445 .
scale(empathy):scale(public_sc)    1.531      1.621   0.944  0.34637
scale(public_sc):statuslow        -9.815      3.695  -2.656  0.00869 **
---
Signif. codes:  0 ‘***’ 0.001 ‘**’ 0.01 ‘*’ 0.05 ‘.’ 0.1 ‘ ’ 1

Residual standard error: 22.69 on 162 degrees of freedom
Multiple R-squared:  0.2968,    Adjusted R-squared:  0.2751
F-statistic: 13.68 on 5 and 162 DF, p-value: 3.876e-11summary(lm(helping ~ status, data = helping))
Call:
lm(formula = helping ~ status, data = helping)

Residuals:
   Min     1Q Median     3Q    Max
-46.31 -18.83  -2.58  19.66  52.85

Coefficients:
            Estimate Std. Error t value Pr(>|t|)
(Intercept)   47.147      2.944  16.016  < 2e-16 ***
statuslow    -10.890      4.045  -2.692  0.00782 **
---
Signif. codes:  0 ‘***’ 0.001 ‘**’ 0.01 ‘*’ 0.05 ‘.’ 0.1 ‘ ’ 1

Residual standard error: 26.17 on 166 degrees of freedom
Multiple R-squared:  0.04184,   Adjusted R-squared:  0.03607
F-statistic:  7.25 on 1 and 166 DF,  p-value: 0.007819